Menu Engineering & Sales Analysis
EZchef’s most unique and compelling feature is its ability to perform visually graphic menu engineering and menu sales analysis for each menu category, and for the entire menu with all your food and beverage items combined.
- Summarizes all Menu Engineering and Item Sales Statistics information for each menu item in tabular format (one table for each of the ten menu item categories)
- Based on the simple input of the Item Sales Mix information from your POS system (e.g. how many of each item you sold in a specified time period), the software graphs each menu item based on the total gross profit dollars it produces, and its corresponding cost of goods sold percentage. This allows you to visually compare the overall profitability of every item in each menu category against all other items in the same category
- Auto calculates the Ideal or Theoretical Cost of Goods Sold percentage of each menu section independently, and provides a summary for your entire menu
- Performs “What If” analysis by permitting you to change the item selling price, the item cost and the number of each item sold. Use this information to optimize your menus overall profitability!
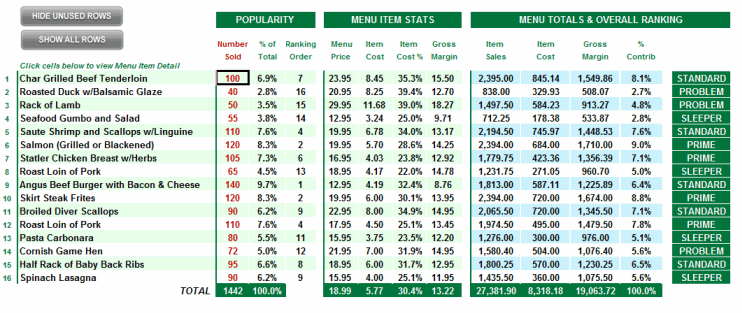
Select the Menu category you want to view (e.g. Entrees was selected below). Remember that each of the ten Menu Categories are user defined to best meet your restaurant’s needs. Use your POS or Cash Register Item Sales report for a specified time period, and enter the number sold of each item as shown below. Once this data is input, the Table will reveal detailed information and rankings comparing each menu items popularity, gross margin, and food cost percentage. The Theoretical Food Cost of each Menu Category is also calculated and displayed.

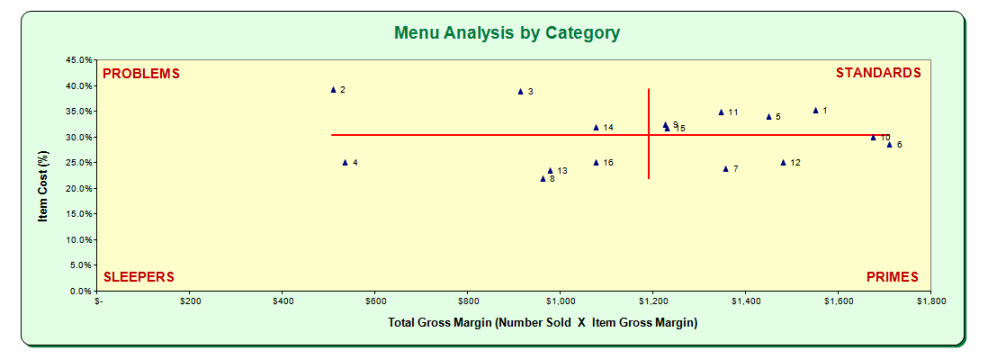
A graphic view of the above Table is a more visual way to see each item’s performance relative to all other items in the Category. Each item is placed on a graph with the X axis (horizontal) representing the Total Gross Margin of each Menu Item for the period (e.g. the number sold times the item’s gross profit). The Y axis (vertical) plots the Food Cost % of each item. The “best” items are the PRIMES, those that produce high gross profit dollars and with low food cost %, and conversely the PROBLEMS generate relatively low gross profit dollars, and do so at a corresponding high food cost %. STANDARDS identify menu items that generate high gross profit dollars but do so at a relatively higher food cost %. SLEEPERS are menu items with low food cost % but because they are not popular, are not high gross profit generators.
Cross reference each item’s number to the Table above, and click on the item’s name to navigate back to its Recipe Cost template. Use this information to proactively manage the menu mix (popularity), selling price and item costs within each Menu Section. This is the most powerful and direct way to increase your restaurants overall profitability. Promote those items that make you money, deemphasize those that do not. Re-price or re-cost other menu items to optimize your overall profitability.
NOTE:
The technique used to generate this analysis is called “Cost Margin Analysis” (D. Pavesic), and detailed information regarding this methodology, and how to effectively utilize it, can be found in “Fundamental Principles of Restaurant Cost Control” (click on link)

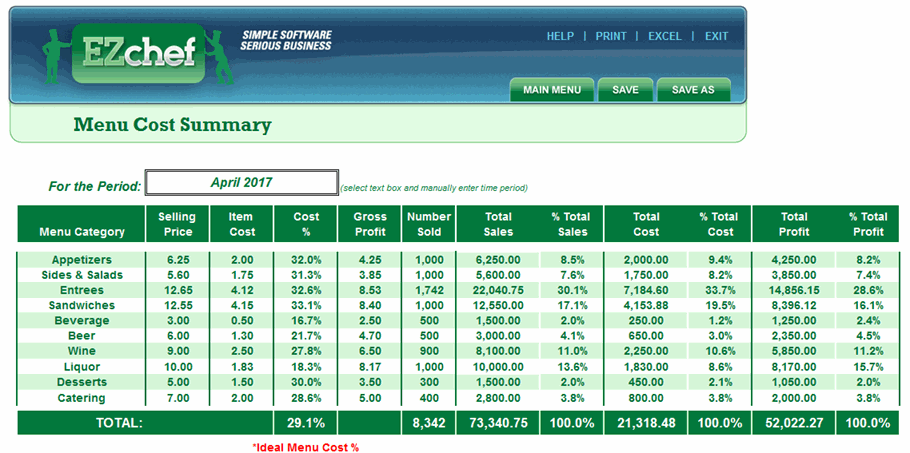
From the Menu Analysis section of the Main Menu select the “Summary Detail” button to view summary details for all menu categories.
